Dashboard Layout: Difference between revisions
From PLC Wiki
No edit summary |
No edit summary |
||
| Line 1: | Line 1: | ||
-------- | -------- | ||
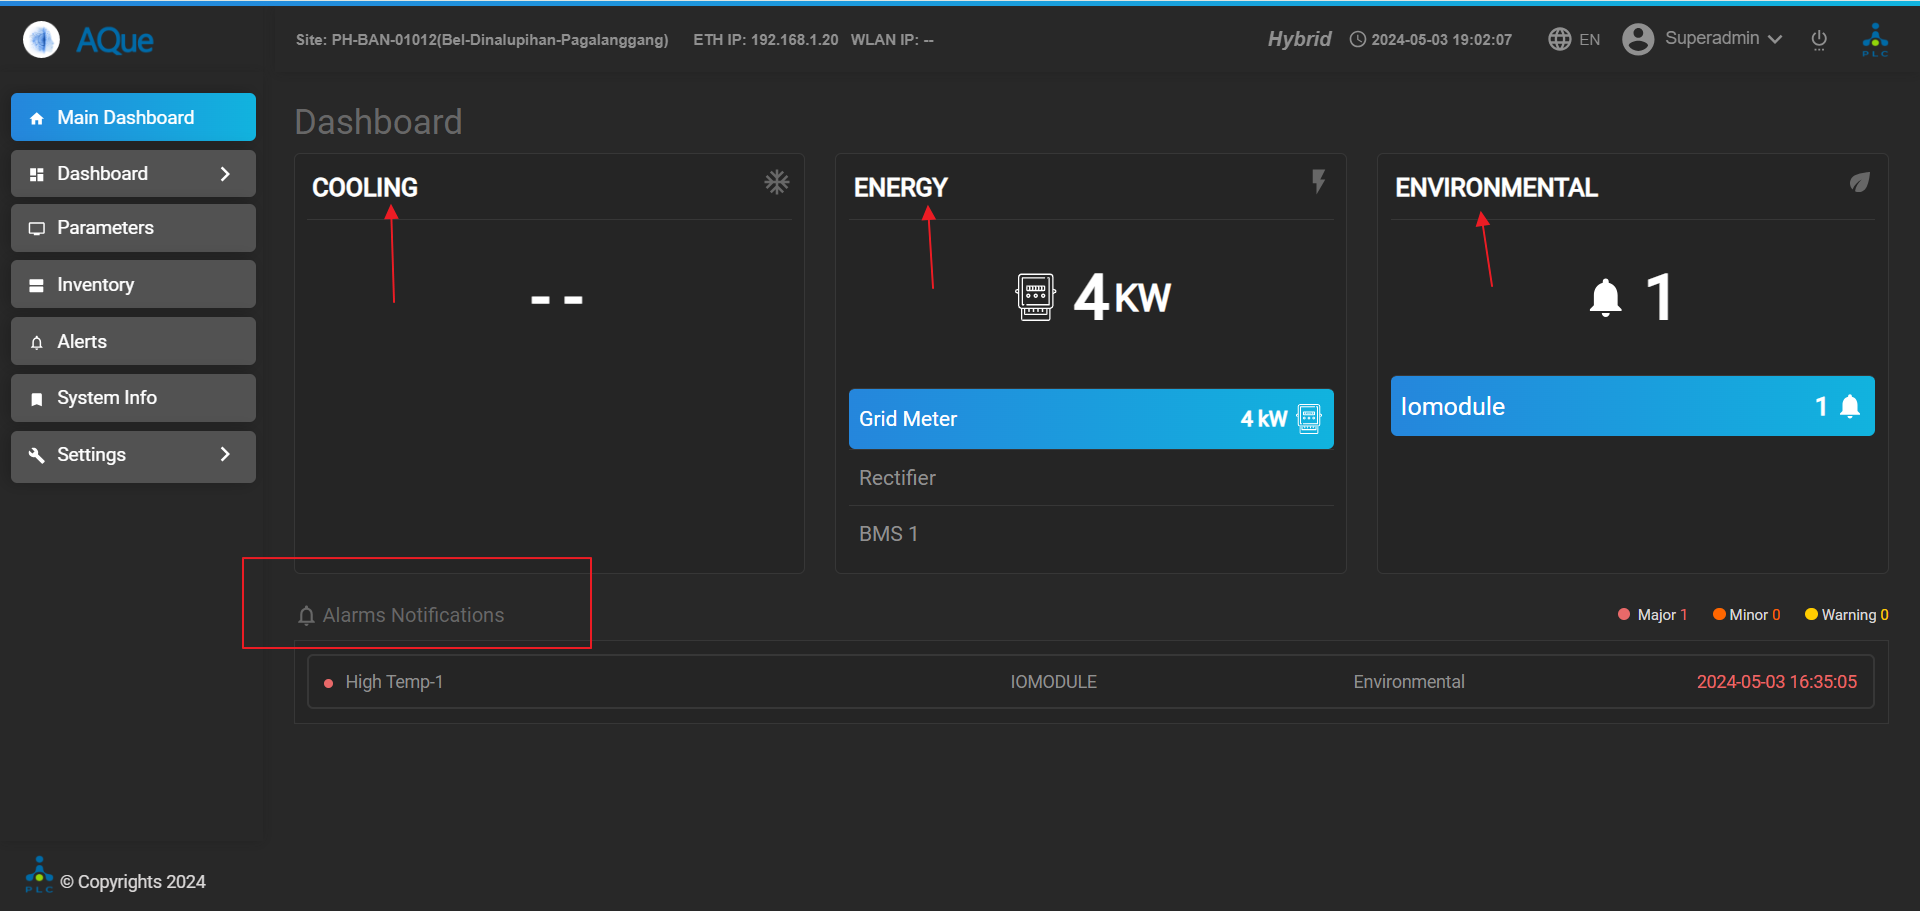
The Landing Page of | The **Landing Page** of AQue Lite is the central dashboard, providing a centralized interface for monitoring and managing critical system metrics and hardware statuses. It offers an efficient and user-friendly experience, enabling our team to quickly access and interpret essential data. The streamlined layout facilitates smooth operations, contributing to improved system performance and reliability. | ||
----- | ----- | ||
| Line 13: | Line 13: | ||
* '''System Overview:''' Shows the amount of time in which the system has been running, resource utilizations, and active alarms. | * '''System Overview:''' Shows the amount of time in which the system has been running, resource utilizations, and active alarms. | ||
* '''User Friendly Interface:''' Makes use of graphics (Graphs, color codes) to enable interpretation of data. | * '''User Friendly Interface:''' Makes use of graphics (Graphs, color codes) to enable interpretation of data. | ||
* '''Easy Access:''' | * '''Easy Access:''' Easy access to device management, alarm, reports, and settings. | ||
* '''Customizable:''' Customize the dashboard to focus on key metrics that interest you. | * '''Customizable:''' Customize the dashboard to focus on key metrics that interest you. | ||
* '''Real-Time Updates:''' Always presents the latest information. | * '''Real-Time Updates:''' Always presents the latest information. | ||
Revision as of 06:39, 2 December 2024
The **Landing Page** of AQue Lite is the central dashboard, providing a centralized interface for monitoring and managing critical system metrics and hardware statuses. It offers an efficient and user-friendly experience, enabling our team to quickly access and interpret essential data. The streamlined layout facilitates smooth operations, contributing to improved system performance and reliability.
Key Features:
- System Overview: Shows the amount of time in which the system has been running, resource utilizations, and active alarms.
- User Friendly Interface: Makes use of graphics (Graphs, color codes) to enable interpretation of data.
- Easy Access: Easy access to device management, alarm, reports, and settings.
- Customizable: Customize the dashboard to focus on key metrics that interest you.
- Real-Time Updates: Always presents the latest information.
- Interactive Alerts: It indicates the alarms with severity indicators and easy means of rectifying them.
- Efficiency: Streamlined navigation increases productivity and fastens the decisions.
- Integration: Access other tools and systems without leaving the dashboard.
In brief, AQue Lite's Landing Page is the central dashboard that centralizes all important system metrics, statuses, and essential functions into a very efficient interface. Given efficiency concerns, it streams live updates and allows for modification of the layout to optimize navigation and monitoring. Thus, by easily getting to all important things at a glance, the Landing Page ensures optimum operational control, which in turn enables swift action and prudent decision making to ensure the performance and reliability of the system.
